What is observability?
Wikipedia describes observability as the following
In control theory, observability is a measure of how well internal states of a system can be inferred by knowledge of its external outputs. The observability and controllability of a system are mathematical duals.
For application developers, and operators this means being able to know if a system is healthy or misbehaving. This is critical for
- supporting both internal, and external customers.
- getting to root cause faster
- predict outages and issues
Supporting Customers
Customers are important for any system. A webapp that serves no customers, and generates no value for a business will not live long. Customers can be fickle. I have experienced situations where customers encountered defects in a system I was responsible for, and they didn’t report them. In one situation the user thought that the defect was an issue with their computer. In another sitation the user just got frustrated and stopped using the application.
In both situations it would have been advantageous for better observability of the system.
Getting to root cause faster
Imagine that for a moment that you work for a major airline, and all of the ticket terminals in the U.S. are unable to operate, and no tickets can be dispensed to customers. Now imagine that you don’t know why this is happening. This isn’t a fictional scenarios. Michael T. Nygard documents a scenarios where this happened in his book Release It. In this situation the operations team didn’t have good visibility into the system, and as a result insane amounts of money were lost as thousands of planes were grounded. If the engineers responsible for this system had spent time investing in observability, they might have quickly realized that the issue was with database connection management.
Predicting outages and potential outages
Recently I was attempting to pull down a docker image from a caching proxy. When I pulled the image directly from docker I was able to download it with no issue what so ever. When I attempted to pull the image from the proxy I encountered an error message telling me that the docker image didn’t exist. The root cause of the issue ended up being that the virtual machine running the proxy ran out of disk space. The sub-system responsible for alerting operations that the machine was running out of disk space was not functioning and as a result an easily avoidable outage occurred.
How do we make a system observable?
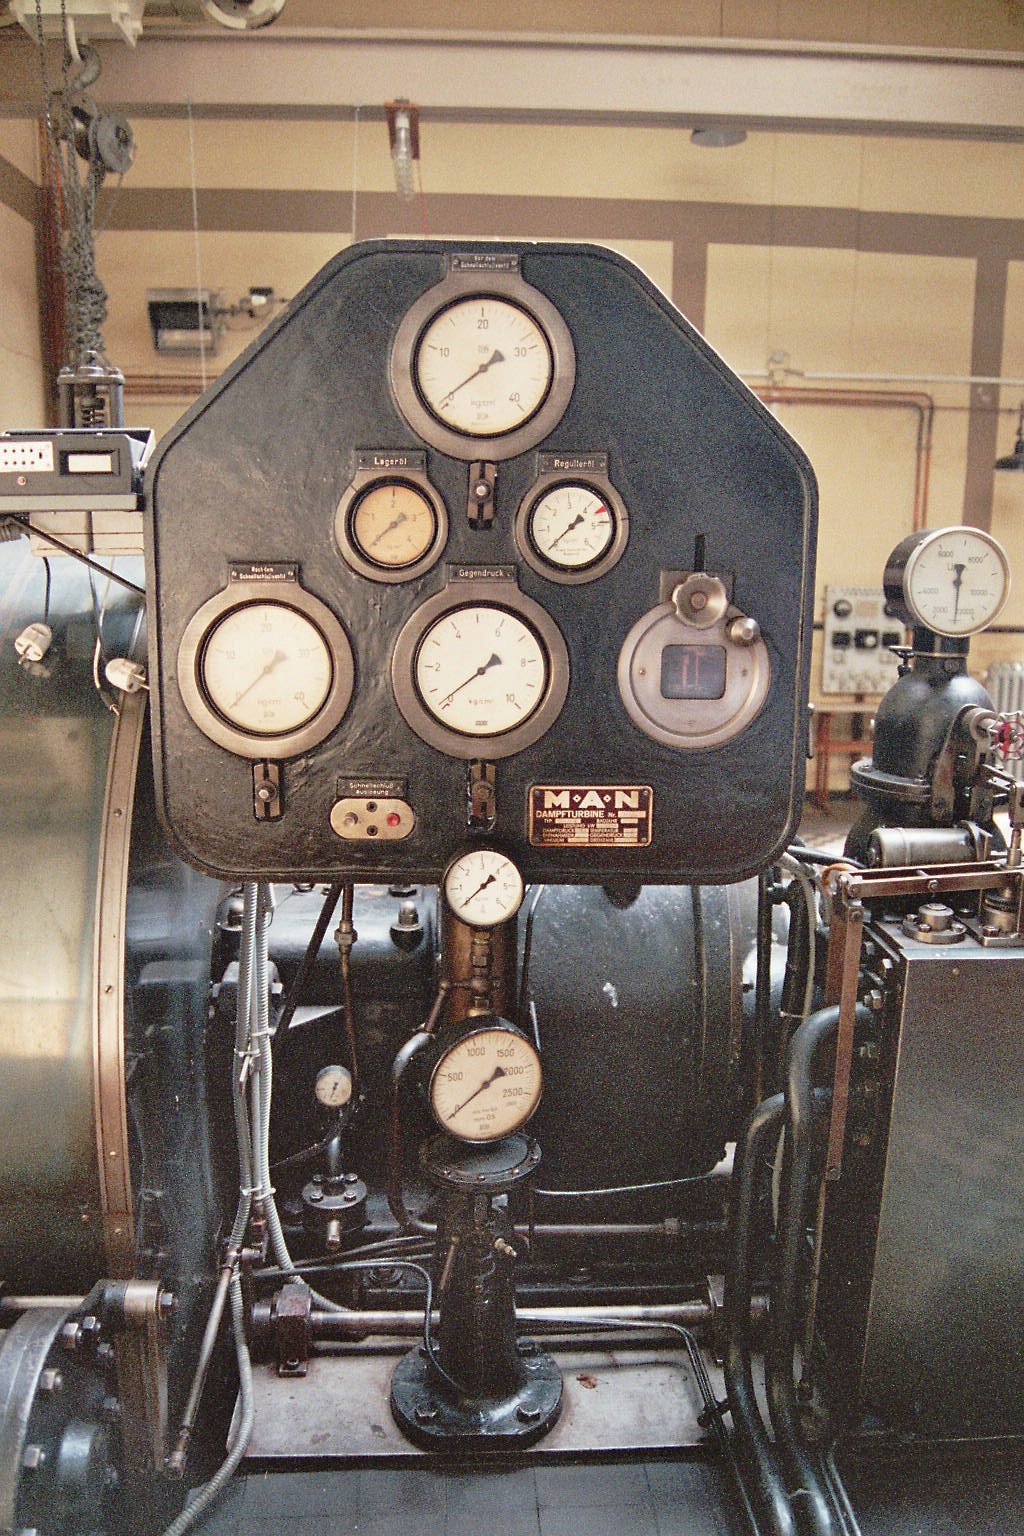
We make systems observable by adding instrumenting the system with gauges, indicators, etc. A steam turbing is a good mechanical example of instrumenting a system. These indicators may inform the operator of the turbine of the speed of the turbine, and amount of steam, the temperature, etc. These variables are then used to inform the operator’s decisions.
For software we have a slightly different set of tools. The three main tools are as follows:
- Metrics
- Tracing
- Logging

All of these different tools bring different information to the table, and no one tool will provide a complete view of the system.
Logging
With logging we can log specific information at specific points in time. Logging is the form of instrumentation that most software engineers are familiar with.
Metrics
Metrics are aggregatable statistics. Histograms, counters, and gauges are all specific types of metrics. I borrowed definitions of these metric types from the Prometheus documentation
Counters
A counter is a cumulative metric that represents a single monotonically increasing counter whose value can only increase or be reset to zero on restart. For example, you can use a counter to represent the number of requests served, tasks completed, or errors.
Gauges
A gauge is a metric that represents a single numerical value that can arbitrarily go up and down.
Gauges are typically used for measured values like temperatures or current memory usage, but also “counts” that can go up and down, like the number of concurrent requests.
Histograms
A histogram samples observations (usually things like request durations or response sizes) and counts them in configurable buckets. It also provides a sum of all observed values.
Compared to logging
Counting up the number of requests that are served could be communicated via logging by logging a counter for each request. Keeping track of a rising, and falling count of open database transactions could be communicated by logging but that would require a background process logging said information each second (or whatever interval you want). Recording a histogram via logging would be even more tricky. Monitoring systems like Prometheus are time series databases that excel in making it easy to add counters, gauges, and histograms to a pre-existing system.
Tracing
Tracing provides very specific information about a specific request. An example of this is the strace linux command. There is a lot of overlap between logging, and tracing but tracing goes into extreme detail about a given operation. In the case of strace you can view the individual system calls, where time is being spent, and even the arguments used. It is possible to log all this information but doing so would result in bloated logs that wouldn’t be very consumeable. It is possible to log all of this information and then filter it and query it using a tool like kibana, or splunk but this is an expensive and work intensive endeavor. Tools like Jaeger provide end-to-end tracing for modern applications that communicate across more than a single machine.